The path · 2 Intermediate
The three views of a project: Blocks, Folded, Table
The finished project of the second tutorial is looked at in its three views: Blocks shows the processing chain, Folded shows many workflows at once and Table manages the files. A session is added and undone, then the settings panel, the GPU list and Run are found.
| Duration | About 10 min, without any computing run |
|---|---|
| Requirements |
|
| Data set | Rosette Nebula (NGC 2237) · Sony A7S, 15 s at ISO 4000 · 130/900 Newtonian · 436 lights (1.8 h), 48 darks, 62 flats, the authors of FLOAT; size 6.9 GB. The frames will be offered for download; the link will be given here |
1Open a finished project
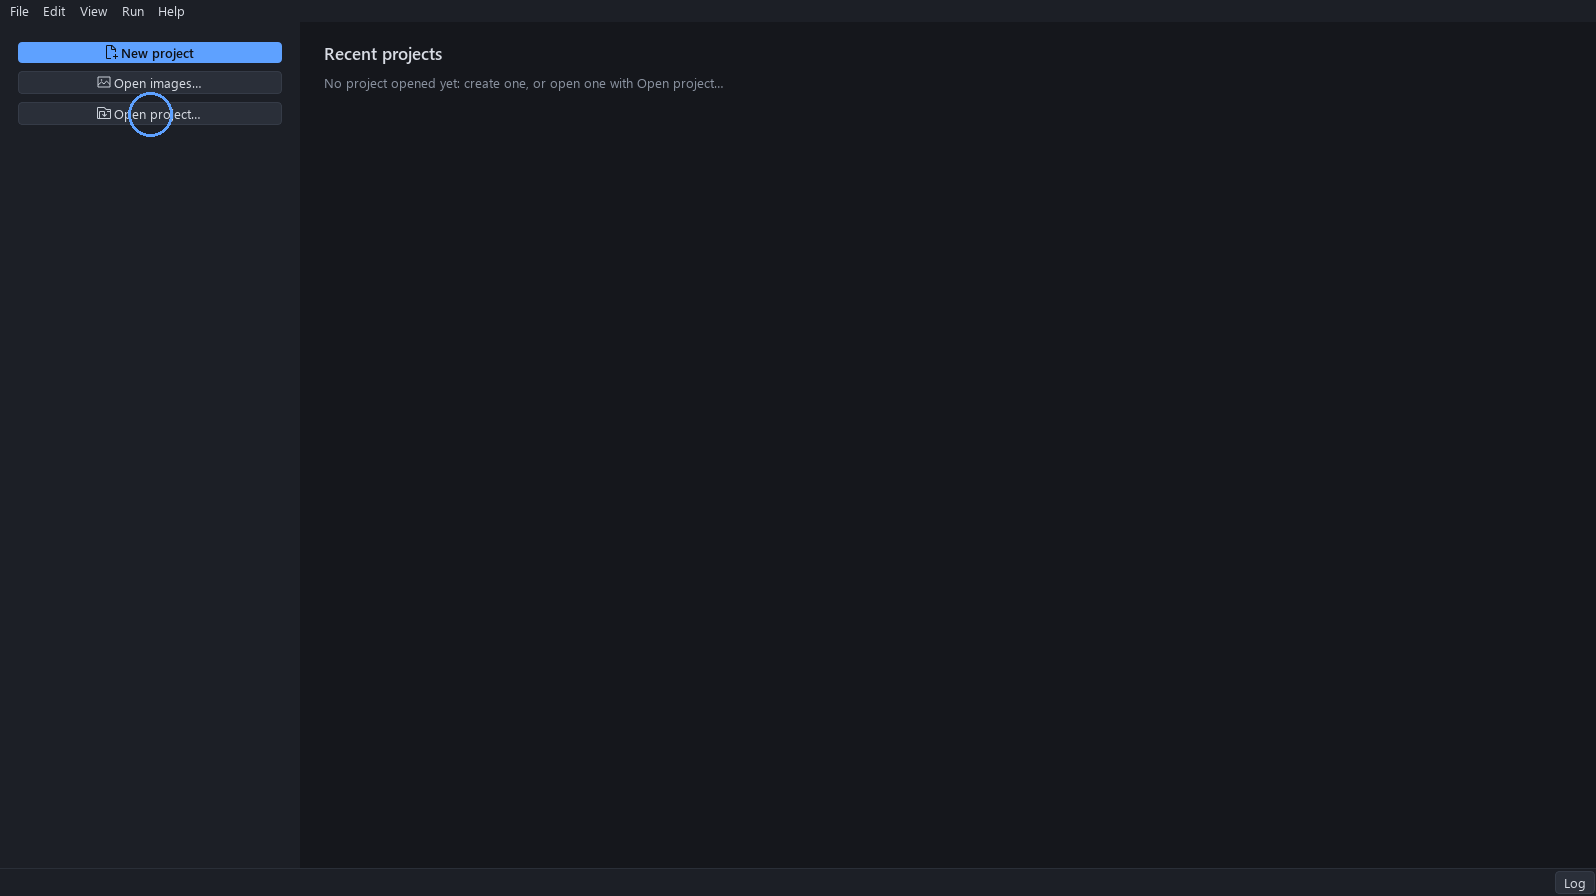
On the Home screen, click Open project… and choose the finished project of the second tutorial, or a copy of its folder. Nothing is computed in this tutorial.
Why. A project opens in the state in which it was saved, so the views below show a real processing and not an empty page.
Expected result. The project opens, and the title bar names it.
2One project, three views
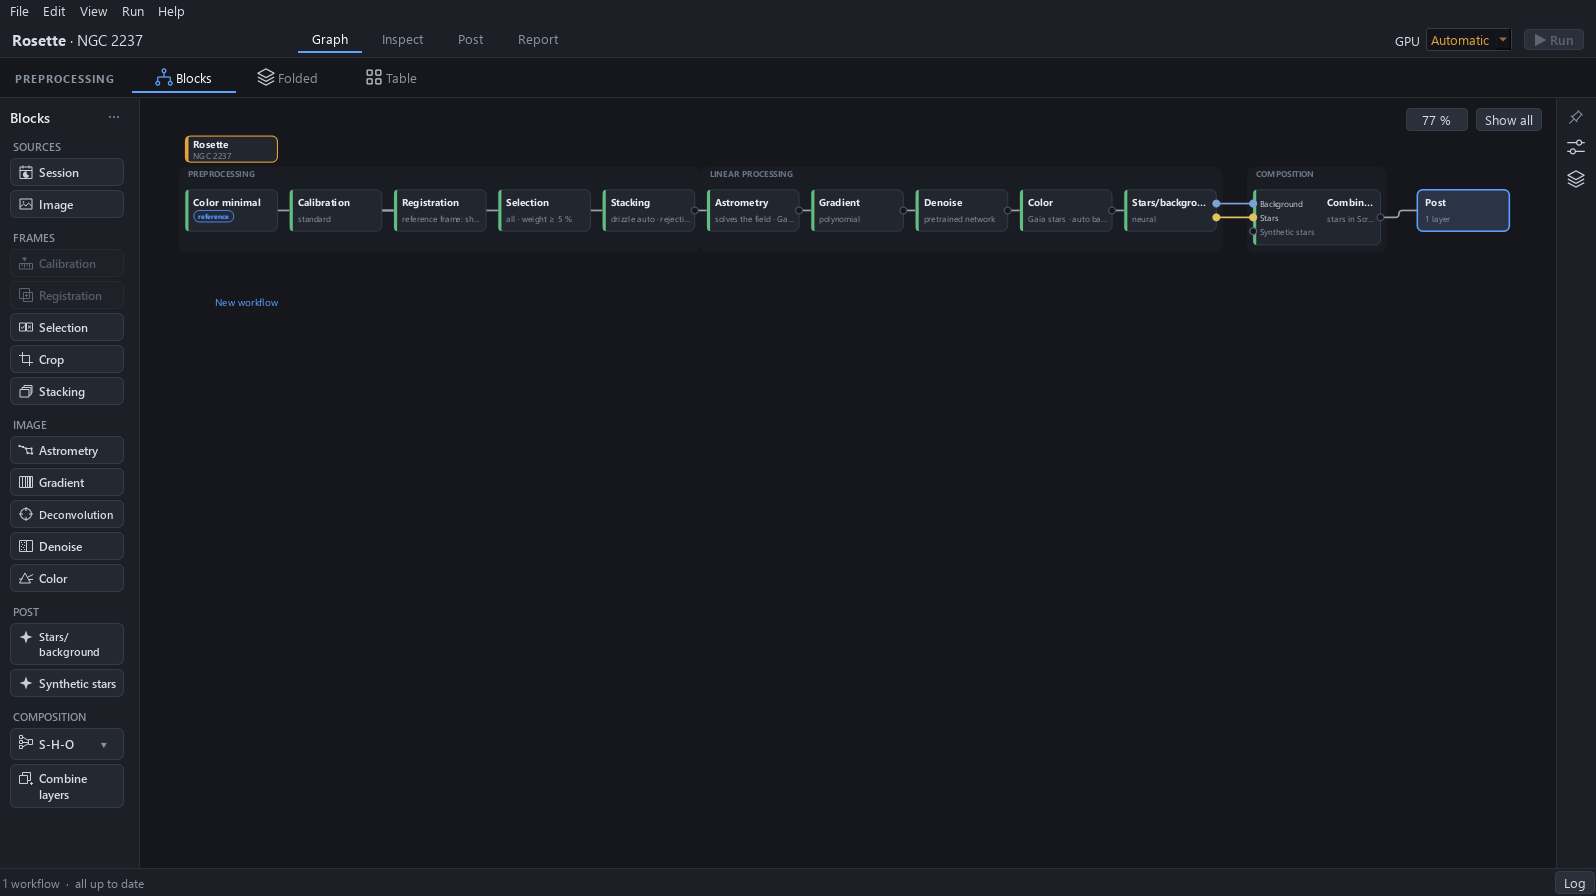
The project opens on the Graph page. Above the graph, Blocks, Folded and Table are three views of the same project: only the way it is drawn changes.
Why. Each view answers a different question: the chain of the processing, many workflows at once, or the files.
Expected result. Blocks is underlined, and the status bar reads all up to date.
3Blocks: the chain
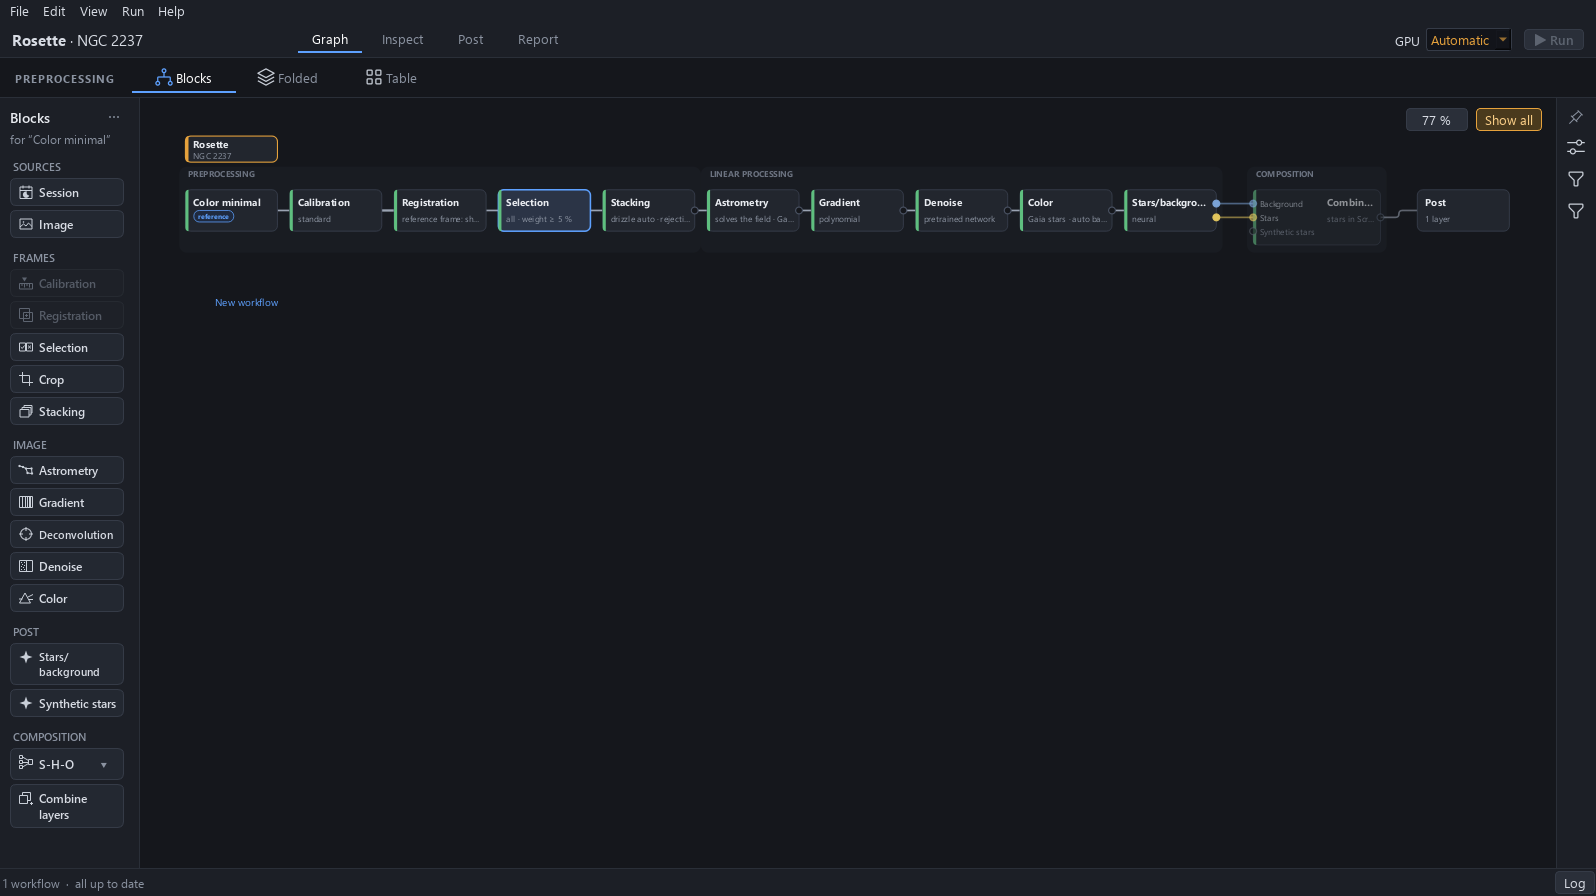
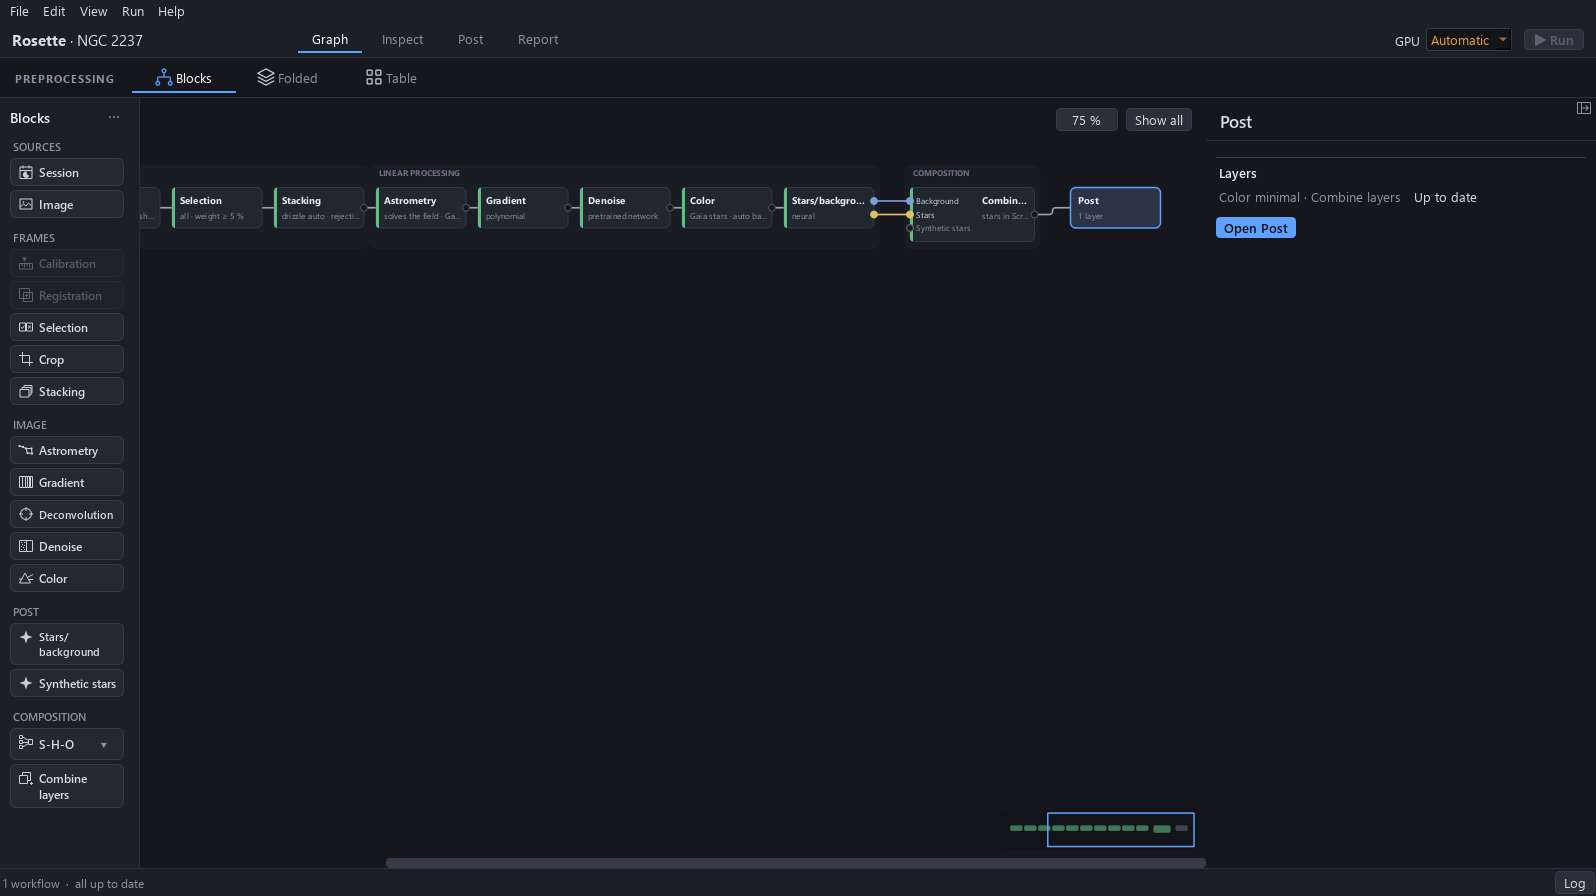
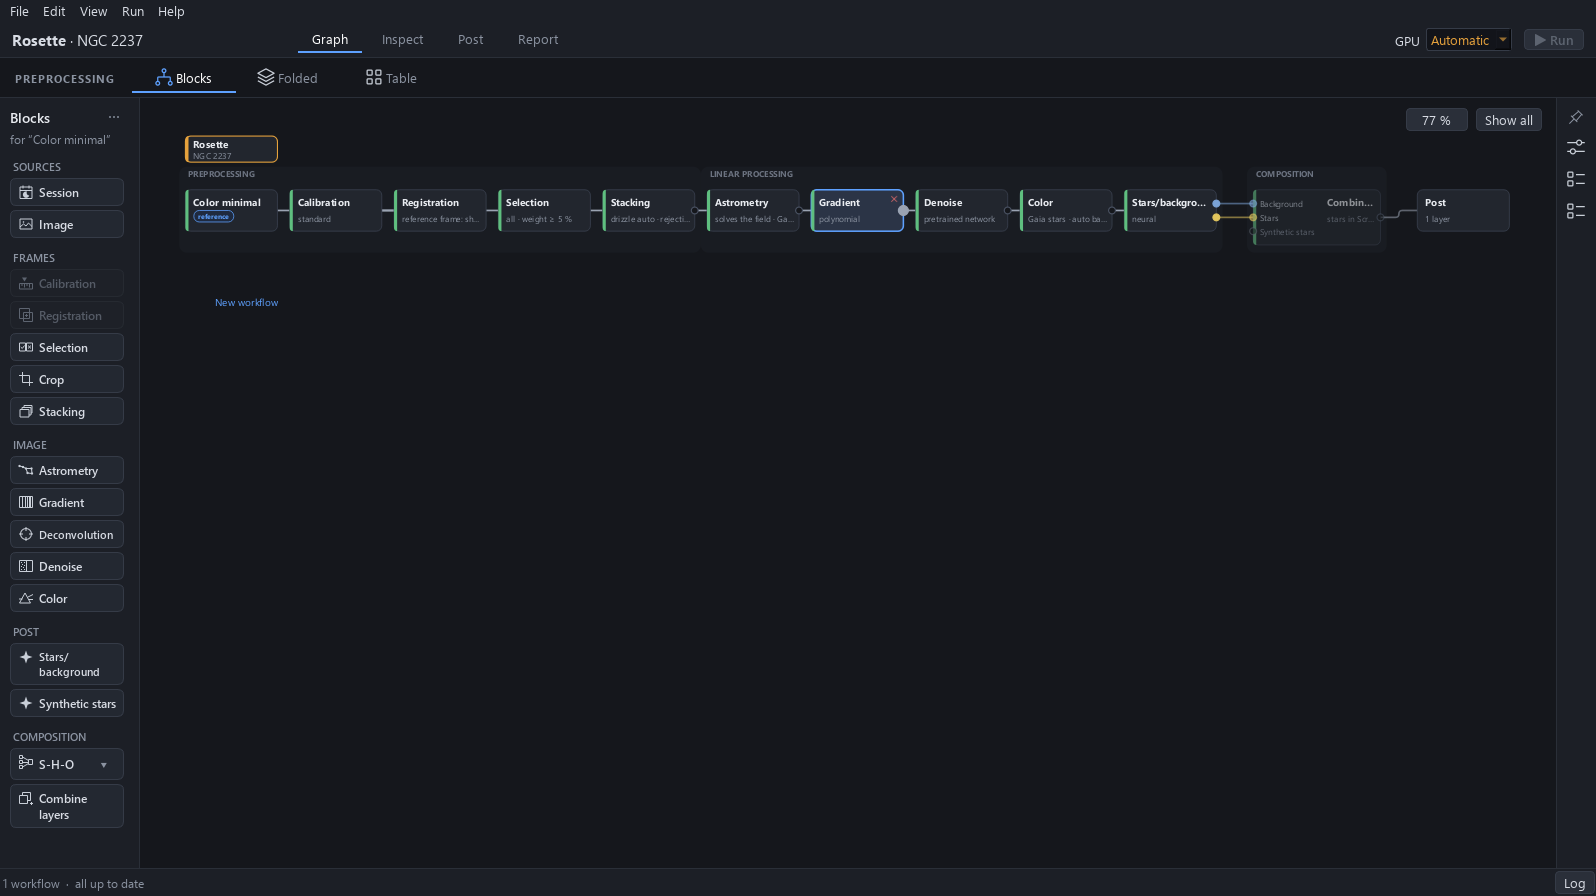
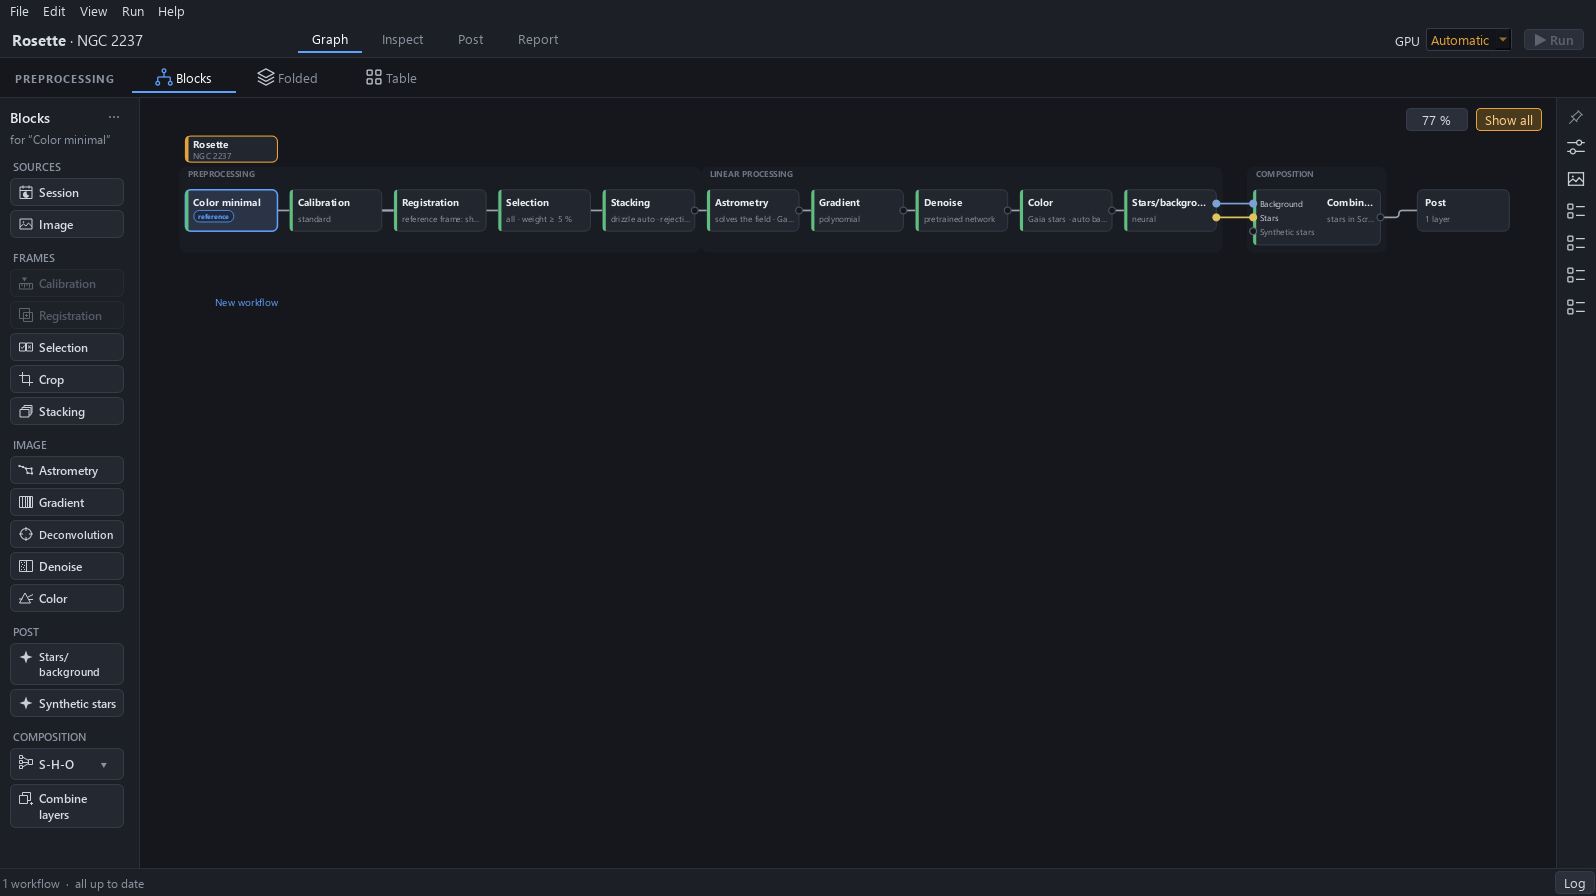
Click the arrow at the top right of the window to fold the settings panel. Blocks draws every block of the chain from left to right, in three bands: Preprocessing, Linear processing and Composition. Post comes last.
Why. Blocks is the view for following the processing in order: the picture goes through each block from the left to Post.
Expected result. The whole chain is on the screen, and every card has a green bar on its left edge.
4A block’s card
Click a card to select it. A block is a card: its name, a summary line of its settings, and a bar on its left edge whose colour is the block’s state. Green means that the block is up to date.
Why. The bar tells at a glance which blocks are up to date and which would be computed again after a change.
Expected result. The selected card has a light outline.
5The palette
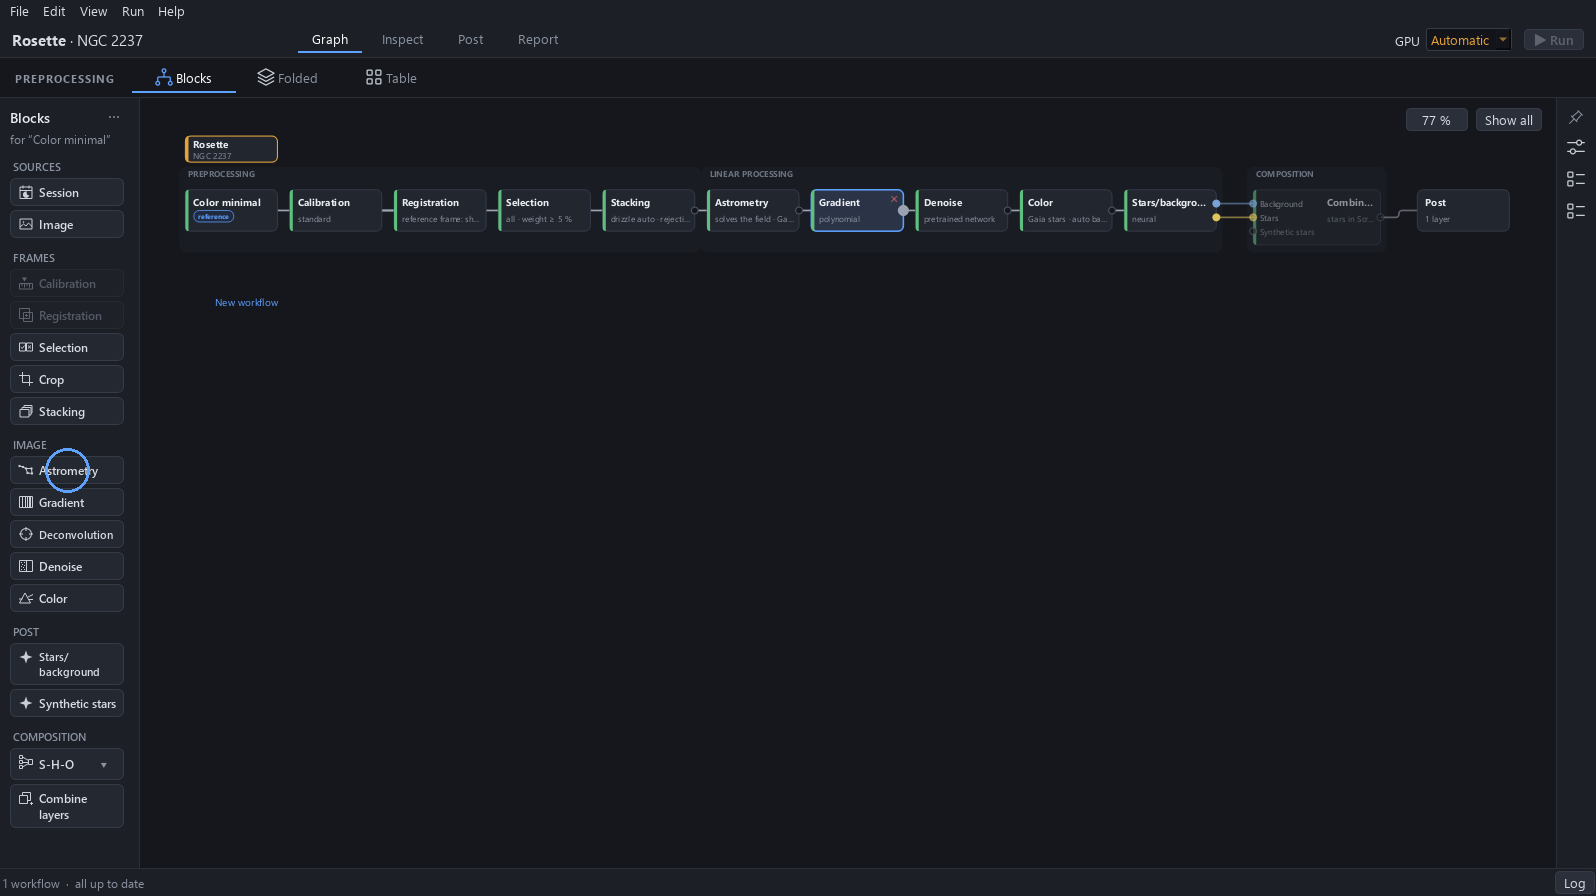
The palette on the left lists the blocks that can be added, in groups: Sources, Frames, Image, Post and Composition. A block is dragged onto the chain or double-clicked, and a block that cannot be added at this point is greyed.
Why. The palette is where a workflow is extended: its header names the workflow that is selected, and the blocks that fit it are active.
Expected result. The palette header reads for “Color minimal”.
6Zoom and Show all
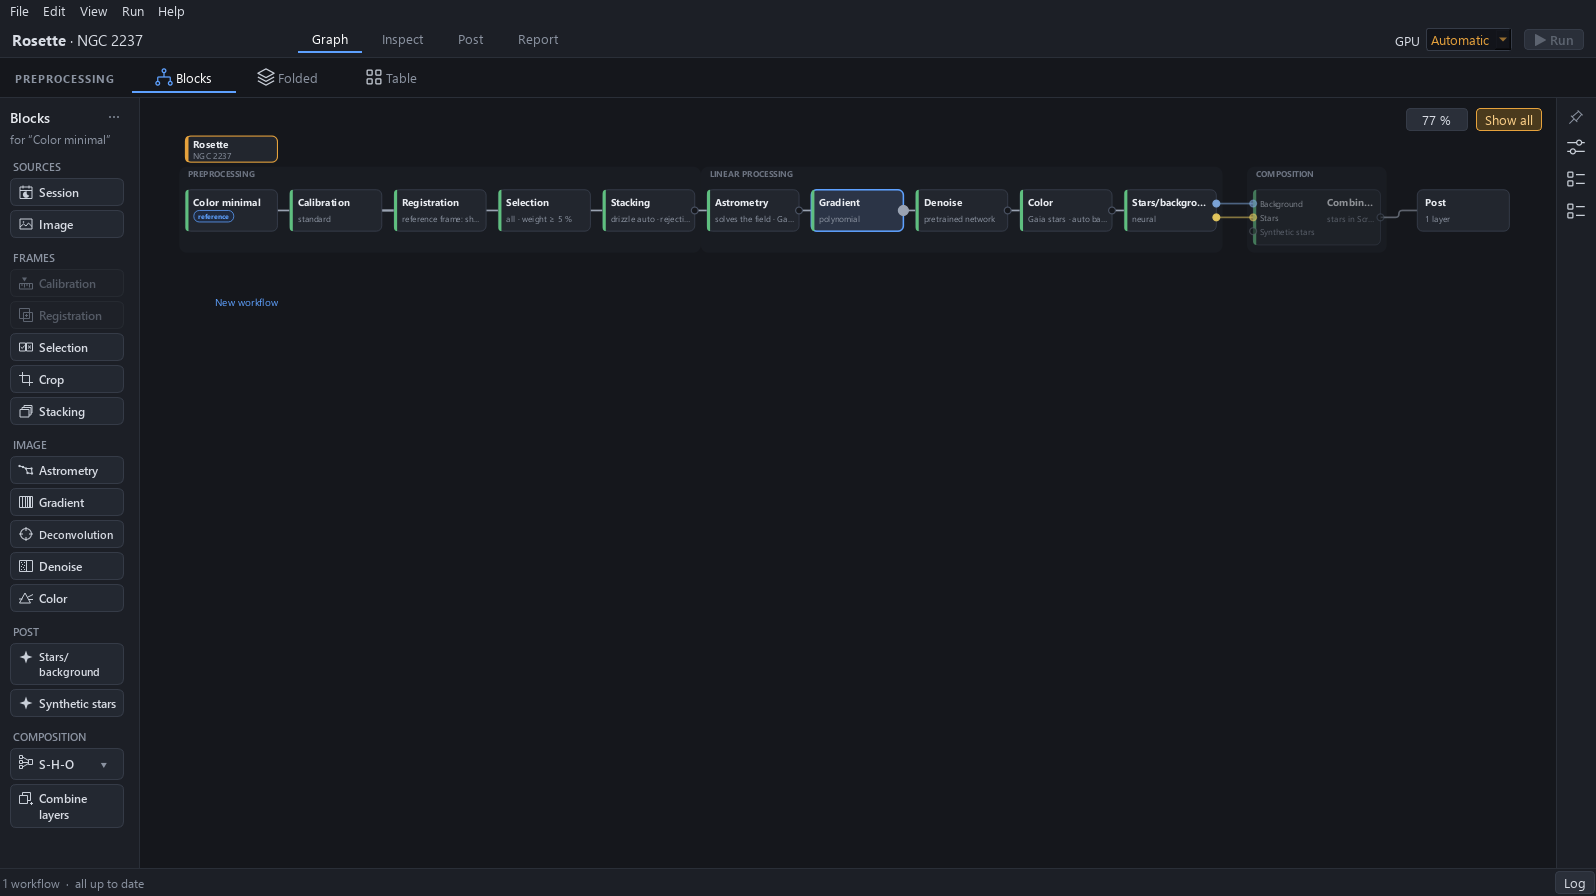
Click the zoom box: it offers fixed sizes, and Show all. Ctrl and the mouse wheel zoom the graph, and the scroll bars move it when it is larger than the window. Click Show all to fit the whole graph in the window.
Why. A long chain or many workflows do not fit at a readable size: zoom to read a card, and Show all to see the whole.
Expected result. After Show all, the whole chain is visible again.
7Folded
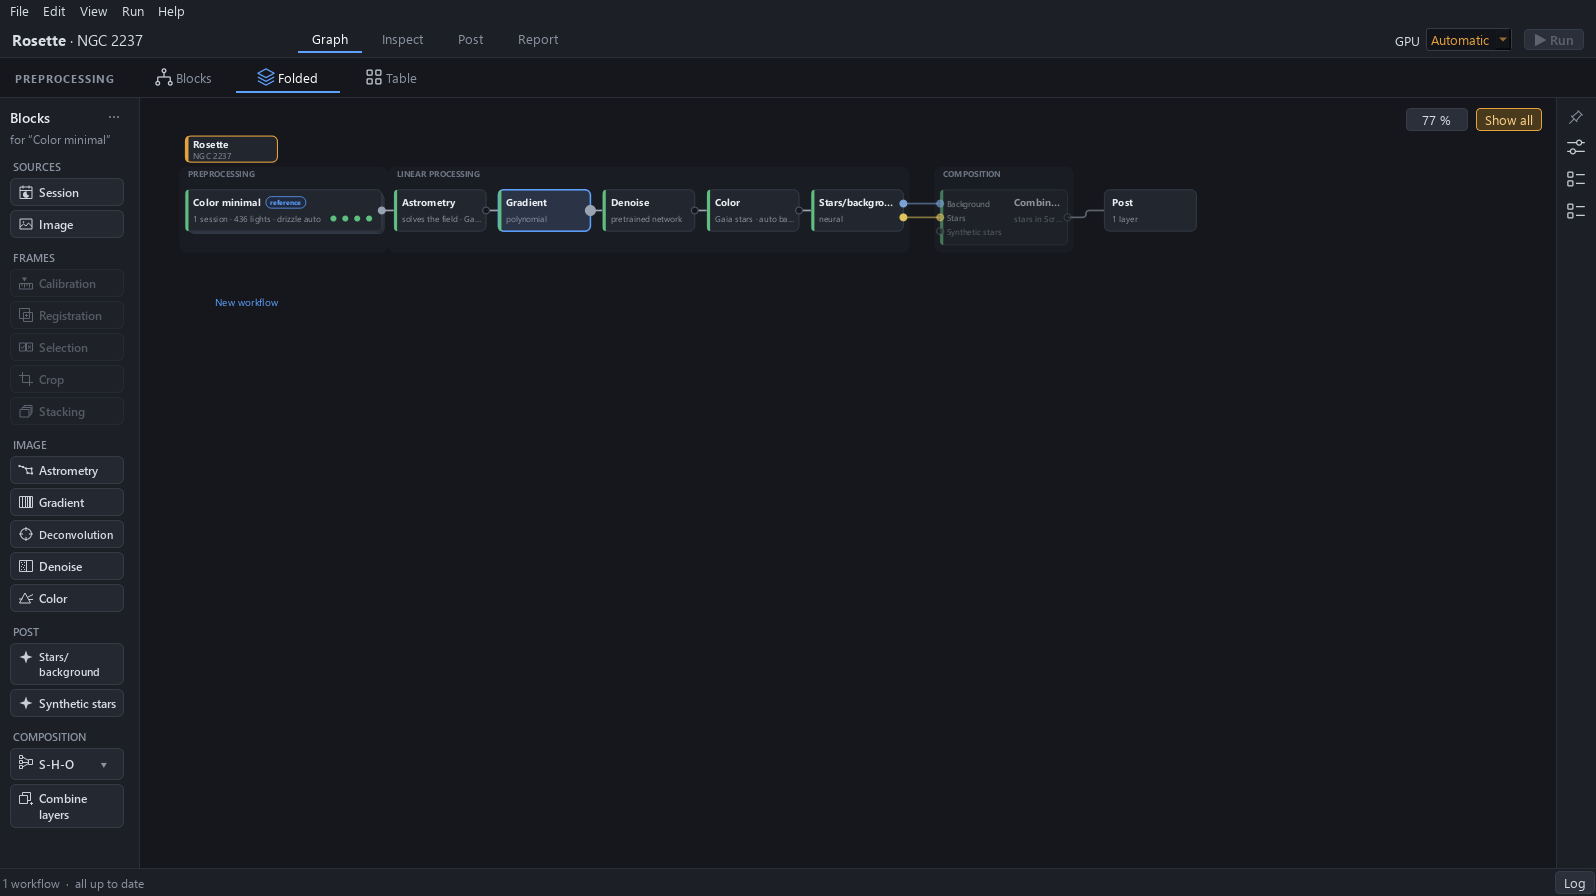
Click Folded. Each stack is drawn as one card: its name, its number of sessions and lights, its stacking method and a row of dots. Astrometry, Gradient, Denoise, Color, Stars/background and Post are drawn as before.
Why. Folded is for a project that holds several workflows at once, as after a variant or with several filters: the frame blocks of each workflow fit in a single card, so that many workflows fit in the window.
Expected result. The Color minimal card reads 1 session · 436 lights · drizzle auto.
8Table: rows and columns
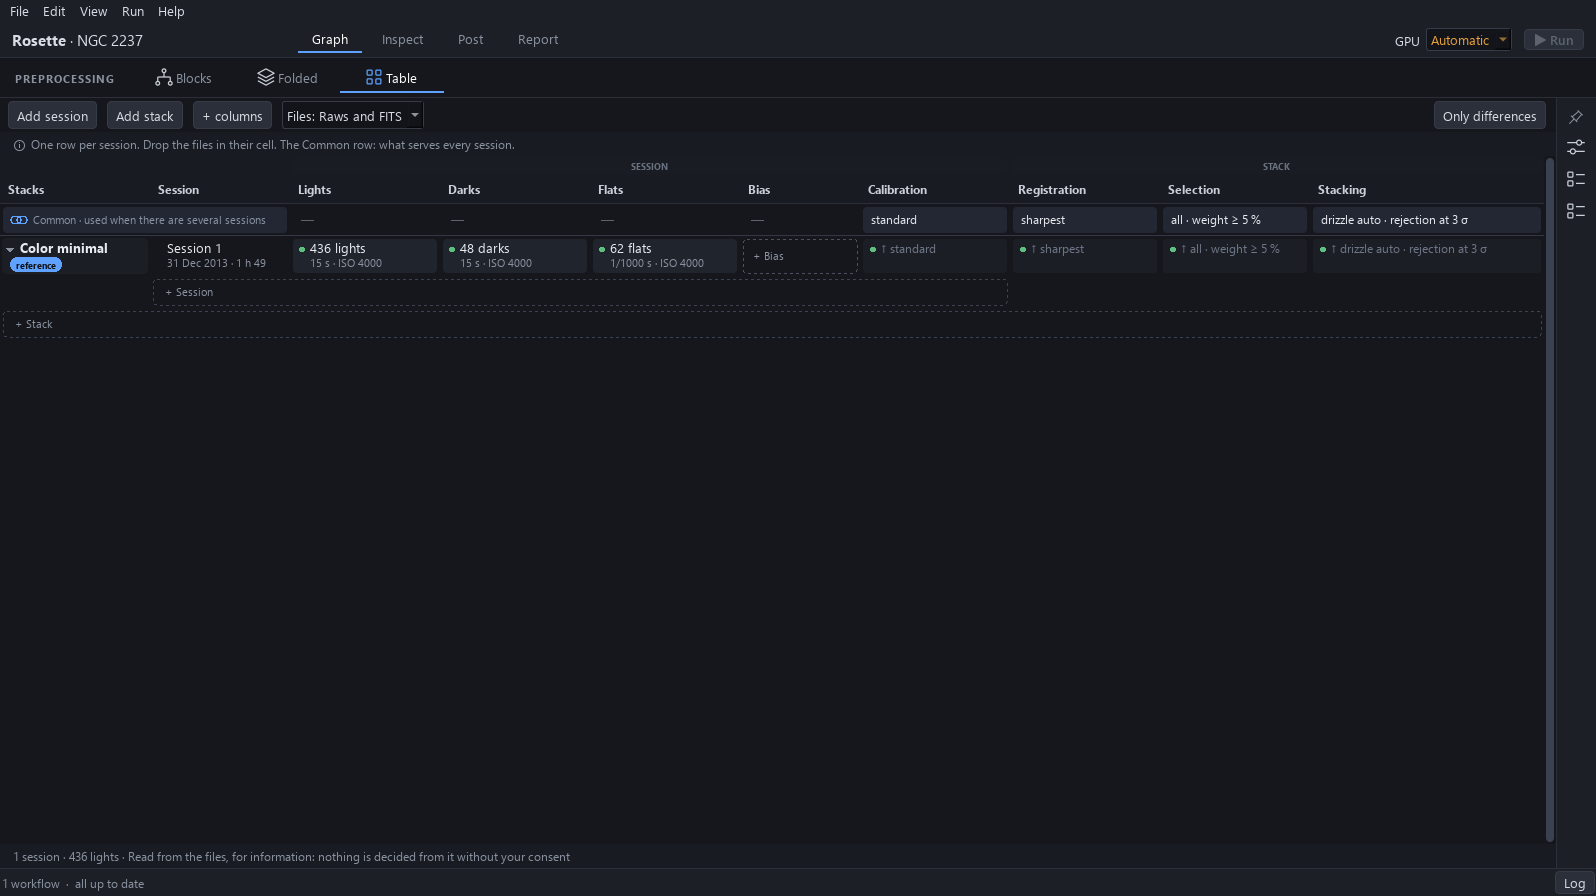
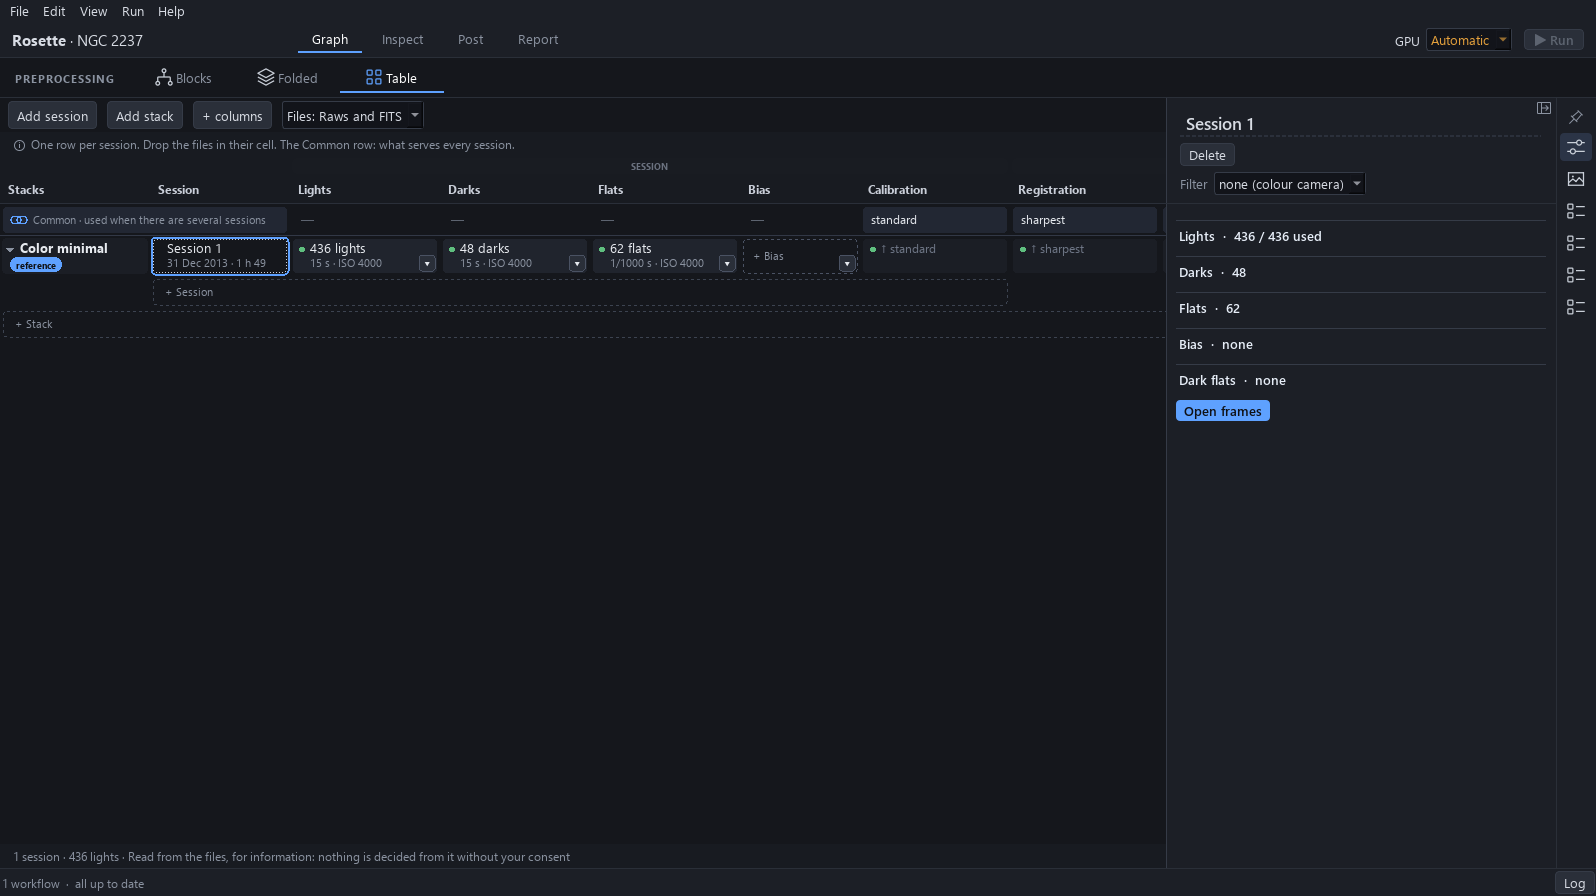
Click Table. It shows the preprocessing as a table, one row per session, under the name of its stack. The Lights, Darks, Flats and Bias columns hold the session’s files, and Calibration, Registration, Selection and Stacking show the settings of the stack. The Common row on top is used when there are several sessions.
Why. Table is for the files, session by session: what each night holds, with its exposure and ISO, and what serves every session.
Expected result. Session 1 reads 436 lights, 48 darks and 62 flats.
9Add session
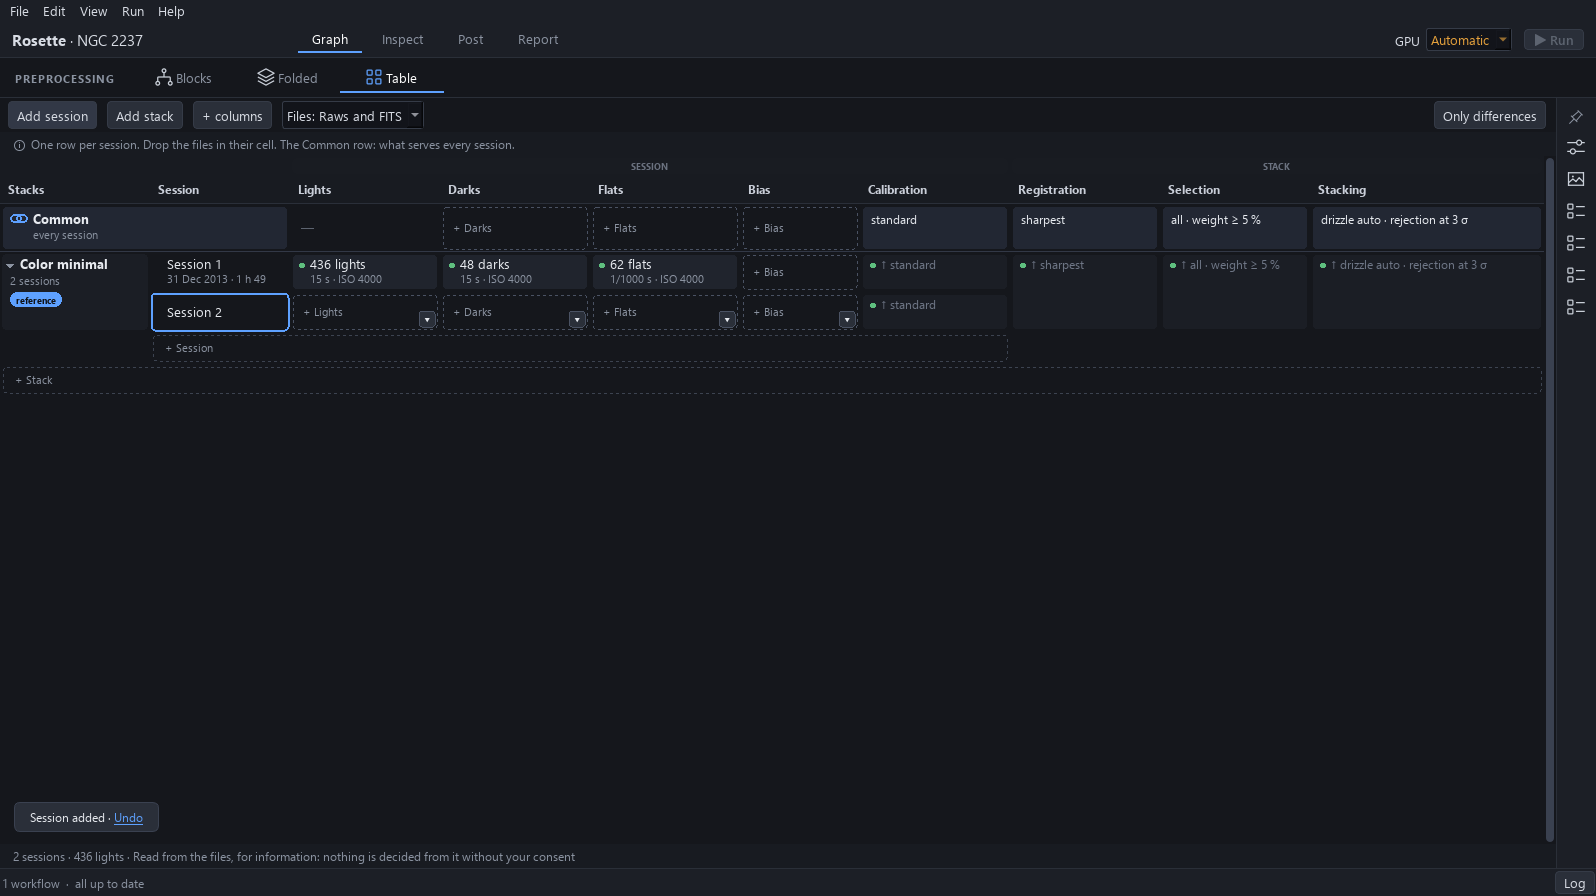
Click Add session: a second row arrives, empty, with no lights, darks, flats or bias. With two sessions, the Common row offers cells for darks, flats and bias.
Why. Several nights of the same target are stacked together, and each night is a session. Files placed in the Common cells serve both sessions, and files placed in a session’s own cell serve that session alone.
Expected result. The status bar reads 2 sessions, and a notice offers Undo.
10Undo
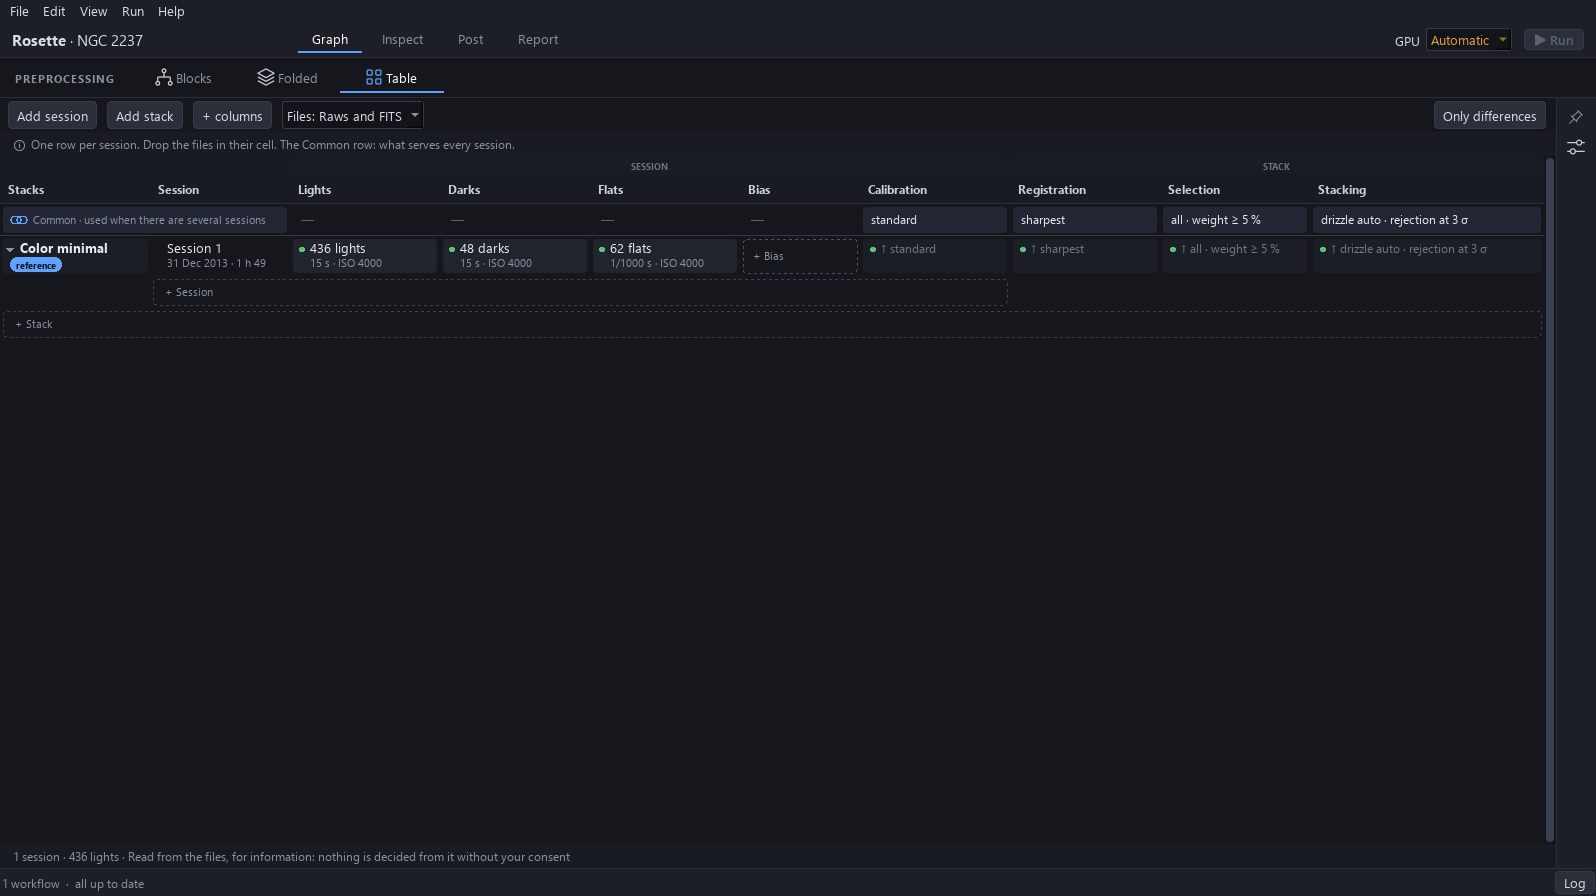
Click Undo in the notice that appears: the session is removed and the table is as it was.
Why. A change to a project can be taken back at once. Here it leaves the project of the second tutorial as it was opened.
Expected result. The table has one row again, and the status bar reads 1 session.
11Add stack and the other buttons
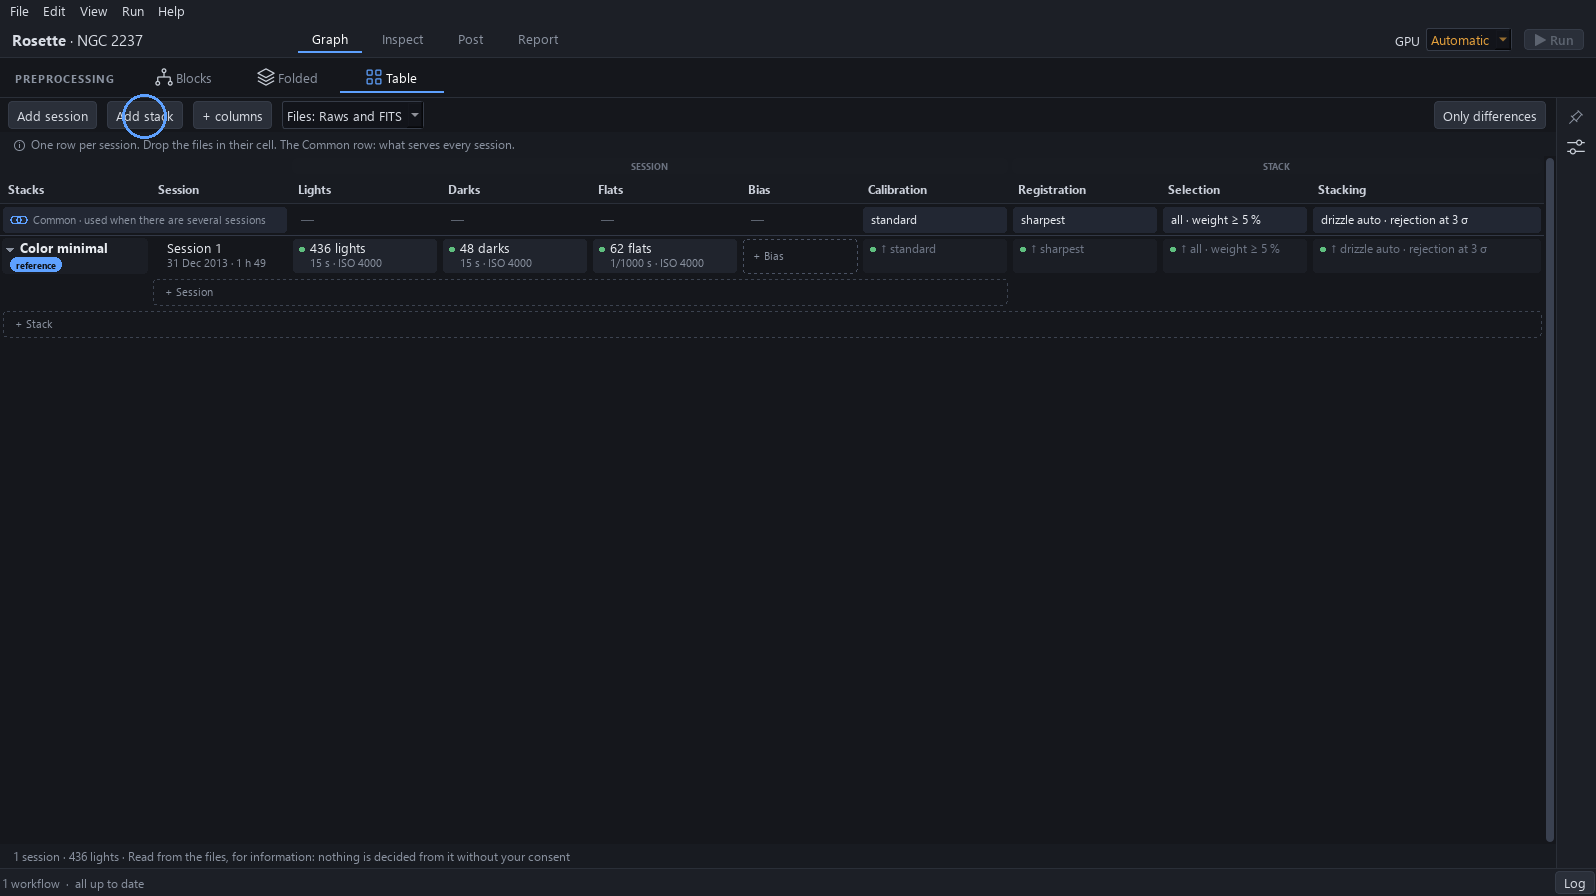
Add stack adds a stack at the bottom of the table, with one session of its own: each stack is one workflow. + columns adds columns, the Files list chooses which files are shown, and Only differences keeps the rows that have something of their own.
Why. This is how a project holds several workflows: one stack per workflow, each with its own sessions.
Expected result. The four buttons sit above the table, left of Only differences.
12Open frames
Click a session’s cell, then the settings button on the right edge. The panel lists the session’s lights, darks, flats, bias and dark flats and its filter, and Open frames adds or changes its frames.
Why. The panel is where a session’s frames are managed; the cells of the table serve to see them and to drop files onto them.
Expected result. The panel reads Lights · 436 / 436 used, Darks · 48 and Flats · 62.
13Back to Blocks
Click Blocks again: it is the same project and the same chain.
Why. Switching views changes only the display. The session that was added was undone, so the chain is as it was opened.
Expected result. The chain is the same as at the start.
14The settings panel
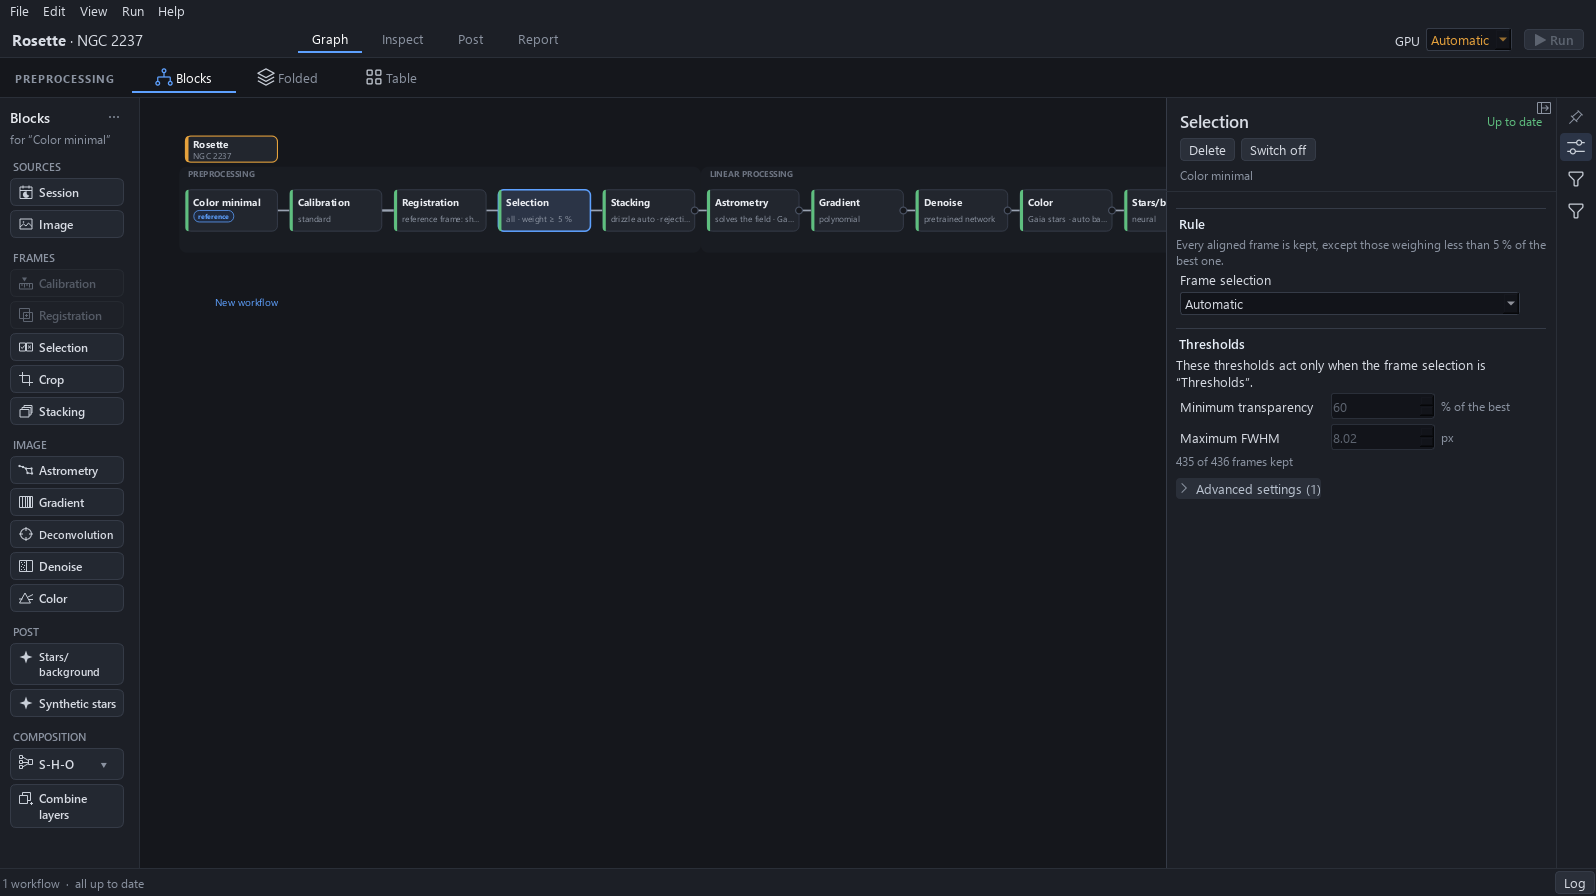
Click a block, then the settings button on the right edge: the panel shows the settings of the selected block, here the rule and the thresholds of Selection.
Why. Every block has its settings in this one panel, so the graph itself stays readable.
Expected result. The panel reads 435 of 436 frames kept.
15GPU and Run
Click the GPU list above the graph: it chooses what computes, Automatic or CPU only. Run starts the computation; it is greyed here because everything is up to date.
Why. Run computes only what is not up to date, and the GPU list is where to choose between the graphics card and the processor alone.
Expected result. The Run button is greyed, and the status bar reads all up to date.